

Abstract: This analysis explores ‘surge and decline’, at the state legislative level. Surge and decline is a phenomenon where members of the president’s party tend to win seats in congress in the year the president is elected, but tend to lose seats in midterm congressional years. We collected the total number of state senators and representatives from both major parties (Democrats and Republicans) in all states for presidential and midterm years from 2010-2020 and just in battleground states from 2000-2020. The surge and decline phenomenon was observed at the state legislative level in all but 2 election years: 2002, the midterm shortly after 9/11, where Republicans saw a surge of support in a traditional decline year, and 2020, where Democrats saw a decline in support in a conventional surge year. State legislative trends tend to track congressional trends, though not necessarily to the same degree. Finally, surges observed were smaller than declines, with the largest surge observed in a surge year (6.32%) being smaller than the smallest decline observed in a decline year (-8.17%).
Background
Surge and decline describes a phenomenon where the president-elect’s party sweeps co-partisans into congress in presidential election years (the surge), and the same party suffers losses in congress in midterm years (the decline). The theory suggests that presidential elections are associated with a lot of energy among voters that increases turnout in presidential years and the loss of the enthusiasm from the presidential election in midterm years causes a loss of US House of Representatives members from the president’s party. This trend is well established at the US House level (Campbell, 1991; Campbell, 1987), and has also observed at the US Senate level (Burmila, 2014). It has also been explored in state legislatures, though not in 40 years (Campbell, 1986a).
James Campbell’s revision of Angus Campbell’s 1960 surge and decline theory (the leading theory in this literature; see Gerschtenson, 2002) argues that: 1) presidential elections cause a surge of voter excitement and participation that recedes once the president is not on the ballot, and 2) independent voters who are caught up in the presidential surge don’t vote as often, or for the President’s party for US House, in midterms when the president is not on the ballot. While this theory has been challenged since its conception, the pattern in US elections is unmistakable, with the sitting president’s party only gaining US House seats in a midterm election 1 time since 1946.
The surge and decline theory is also intimately related to the well-studied concept of presidential coattails. Presidential coattails is a name for the fact that the elected-President’s party often sees increased support at all levels of the ballot in presidential years (this is the ‘surge’ in surge and decline). The work in this area suggests that the visibility and energy around the presidential contest results in the president-elect ‘sweeping in’ copartisans on their ‘coattails.’ The concept has been tested in the US House (Cambell, 1986b), in the US Senate (Campbell & Sumners, 1990). At the state legislative level, Campbell found that state legislatures do appear to see presidential coattails (AKA a surge) in presidential years, and they see losses in midterm years when the presidential coattails are absent (AKA decline; 1986a).
Surge and decline theory is essentially an extension of coattails theory. It argues that presidential coattails cause the surge in years in which congressional election coincide with presidential elections, and the lack of presidential elections (and their coattails) in midterm years contribute to the decline in turnout and support for the sitting-president’s party, leading to losses.
However, whether this same pattern exists for state legislature seats is not well- or recently-studied. This analysis sought to determine, for the years 2010-2020, if the president’s party lost or gained seats in state legislatures during the midterm elections. Further, how does the magnitude of this shift compare to the change in congressional seats? This report will explore the extent to which this trend at the congressional level does or doesn’t extend to state legislatures.
This report focuses on the surge and decline phenomenon in state legislative chambers across the US from 2010-2020 and select battleground states from 2000-2020. It also looks at the magnitude of state legislative surges and declines alongside congressional trends.
Method
To investigate the surge and decline phenomenon, we collected data about partisan control of state legislative seats from Ballotpedia, National Conference of State Legislatures, and Wikipedia. We collected data on control of all state legislative seats in January of the year after the election and control of all state legislative seats at the time of the election for all presidential and midterm election years from 2010-2020. Nebraska was excluded from this analysis, because it has a unicameral legislature that does not recognize legislators’ partisan affiliations.
For the battleground state analysis, we included Arizona, Florida, Georgia, Michigan, Minnesota, Nevada, North Carolina, Pennsylvania, Texas, and Wisconsin. We collected 2000-2008 data for all 10 battleground states except Florida, Michigan, and Nevada. We also collected data about partisan control of federal seats in congress from US House of Representatives and US Senate records.
Note that in this analysis, “congress” and “congressional” generally refers to the combined House of Representatives and Senate, unless otherwise stated. US Senate was included due to the fact that there is evidence for surge and decline and presidential coattails at the US Senate level (Burmila, 2014; Campbell & Sumners, 1990; though it may be weaker than in US House), and also due to the fact that state senate seats were included alongside state house seats in the state legislative numbers.
State legislative gains were measured as the difference in the number of representatives and senators from a given party post-election aggregated across both chambers in each state included in the analysis, compared to pre-election, divided by the number of seats the party controlled across the state’s chambers pre-election. The difference between the number of representatives serving in a party post-election and pre-election constitutes the party’s gain in seats. The percentage increase in seats was calculated by dividing each party’s gain in seats by the number of representatives from that party pre-election each year. For example, if Democrats had 50 seats before the election and 55 seats post-election, the gain would be 5, and the associated percentage increase would be 10%. If a party lost seats in an election, the gain was negative; therefore, the percentage represents a decrease in the number of seats as opposed to an increase. These decreases in seats held are denoted by a negative sign before the percentage listed for gains. For example, if Democrats had 55 seats pre-election and had 50 seats post-election, the gain in seats is -5, and the associated percentage decrease would be -9.09%.
Congressional gains are measured as the difference in the number of members from a given party across both chambers of Congress when a congress is convened (e.g., the 117th congress) and when the previous congress was convened (e.g., the 116th congress), divided by the number of members from that same party when the previous congress was convened (e.g., the 116th congress). The difference between the number of members serving in a party in the congress convened after an election and the congress convened prior to the election constitutes the party’s gain in seats. The percentage increase in seats was calculated by dividing each party’s gain in seats by the number of members in that party from the previous Congress. These measures were calculated and presented the same way as the state legislative gains and percentage increases. Changes in partisanship control of seats that happened outside of an election (e.g., special elections, appointments to open US Senate seats) are unaccounted for in this data.
For the exploratory battleground analyses, we looked at 10 “swing” states going back to the 2010 election and 7 of those states going back to the 2000 election. The states chosen as battleground states had the 10 closest 2020 presidential race 2-way margins: Arizona, Florida, Georgia, Michigan, Minnesota, North Carolina, Nevada, Pennsylvania, Texas, and Wisconsin. In addition to their close margins in the 2020 election, 8 of the 10 states have been in the 10 closest margins in 2 or more of the past 3 Presidential elections (2020, 2016, and 2012). The other states, Texas and Georgia, have rapidly changing demographics as both are popular destinations for folks moving from more expensive, progressive states. The states omitted from the 2000-2008 elections due to data availability are Florida, Michigan, and Nevada. It is important to note that the elections represented in these data were conducted using 3 different sets of legislative and House of Representatives maps (2000, 2002-2010, 2012-2020).
Specific aims. This analysis had 4 main goals.
1) It sought to determine if there was evidence for the surge phenomenon at the state legislative level, where the elected president’s party experiences an increase in seats occupied in the state legislature in presidential election years.
2) It also sought to determine if there was evidence of the reverse phenomenon, decline, where the sitting president’s party loses state legislative seats in midterm years.
3) It investigated how these state legislative surge and decline trends relate to the trends seen at the congressional level. And,
4) we investigated a longer period in a select number of swing states to see what the measures look like in some of the country’s most competitive chambers.
Results
(1) Surge phenomenon at the state legislative level
a. Full dataset
The traditional understanding of the surge part of surge and decline suggests that the president-elect’s party usually wins seats in the US House due to a surge of enthusiasm in presidential years. This is known as the surge (or presidential coattails). The first aim of this report was to look at the surge phenomenon at the state legislative level.
In the full dataset, the presidential years are the 2012 re-election of Barack Obama, the 2016 election of Donald Trump, and the 2020 election of Joe Biden. Both the 2012 and 2016 elections followed the expected surge pattern, where state legislative Democrats (2012) and state legislative Republicans (2016) saw an increase in seats their parties controlled in aggregate across the country. But 2020 did not, with Democrats losing aggregate seats in state legislatures and Republicans seeing an even bigger increase in state legislative seat control the year Biden was elected than the surge they saw during Trump’s 2016 election (see Table 1).
These trends suggest that the surge and decline pattern often, but not always, holds true at the state legislative level. Further, this dataset only comprises 3 presidential elections. A minimum of 6 or more presidential election cycles would be ideal for establishing a more reliable pattern. However, it is important to note that modern politics and partisanship may be distinctly different from past trends. Shifts from past trends would be in keeping with evidence that the surge and decline phenomenon at the congressional level is becoming weaker/less reliable as presidential coattails (a driving force behind presidential surge) are less reliable in the modern era (Ferejohn & Calvert, 1984). Further, map changes and changes in the number of US House representatives in different states each decade due to redistricting make comparisons over a long period challenging.
Table 1. Presidential year state legislative seat surges by party
| Election | President elected | D seats (post-election) | R seats
(post-election) |
Net D gain from prev election | R gain from prev election |
| 2012 | Obama (D) | 3,501 | 3,907 | 145 (4.39%) | -37 (-0.94%) |
| 2016 | Trump (R) | 3,129 | 4,203 | -44 (-1.40%) | 122 (2.97%) |
| 2020 | Biden (D) | 3,312 | 4,007 | -131 (-3.79%) | 150 (3.89%) |
b. Battleground Analysis
In order to help clarify if there is a pattern over more years/presidents, we investigated surge trends in battleground state presidential elections from 2004-2020. It appears that parties saw surges in support for the president’s party downballot in 2004, 2008, 2012, and 2016, but not in 2020. This means that, from 2004-2016, the elected president’s party saw an increase in seats occupied in battleground state legislatures. It is noteworthy, though, that both parties saw a slight increase in seats occupied in battleground states during the 2016 election, with Democrats gaining more seats than Republicans. However, in 2020, the elected president’s party saw a decrease in state legislative seats. See Table 2.
It is interesting to note how, even when the pattern is followed, the numbers tend to be small. For instance, the 2008 landmark election of Barack Obama only saw a downballot net increase of 11 seats for Democrats in battleground states. It is unclear if these relatively small shifts were responsible for a significant shift in the ultimate partisan power in state legislatures.
Table 2. Presidential year state legislative seat surges by party (battleground states only)
| Election | President elected | D seats (post-election) | R seats
(post-election) |
Net D gain from pre-election | R gain from pre-election |
| 2000 | G.W. Bush (R) | 647 | 614 | * | * |
| 2004 | G.W. Bush (R) | 566 | 694 | -20 (-3.42%) | 24 (+3.56%) |
| 2008 | Obama (D) | 645 | 617 | 11 (+1.74%) | -9 (-1.43%) |
| 2012 | Obama (D) | 686 | 947 | 41 (+6.32%) | -33 (-3.36%) |
| 2016 | Trump (R) | 632 | 1000 | 6 (+0.96%) | 3 (+0.30%) |
| 2020 | Biden (D) | 720 | 911 | -18 (-2.44%) | 18 (2.01%) |
*We only have pre-2000 election data for 4 of the 10 battleground states: Arizona, Minnesota, Pennsylvania, and Wisconsin, so 2000 election gains cannot be calculated.
(2) Decline phenomenon at state legislative level.
a. Full Dataset
The other side of the coin is decline, where the sitting president’s party tends to lose seats downballot in midterm years. We observe this phenomenon in the 2010, 2014, and 2018 midterm elections. We observed a large loss for Democrats during Obama’s first midterm election, a smaller-sized loss during Obama’s second midterm, and a similarly sized Republican seat loss during Trump’s midterm election. See Table 3.
This analysis suffers from the same short timeline as the surge analysis. Still, with more consistent data, it suggests that the seat loss for the president’s party in the midterm election may be more reliable than the surge associated with a Presidential election in recent years. This imbalance may indicate something about presidential coattails, which are missing during midterm years.
Table 3. Midterm year state legislative seat declines by party
| Election | Sitting president | D seats | R seats | D gain from prev election | R gain from prev election |
| 2010 | Obama (D) | 3,356 | 3,944 | -675 (-16.75%) | 698 (21.50%) |
| 2014 | Obama (D) | 3,173 | 4,081 | -328 (-9.59%) | 174 (4.56%) |
| 2018 | Trump (R) | 3,443 | 3,857 | 314 (9.64%) | -346 (-8.60%) |
b. Battleground Analysis
The same pattern seen nationwide was also seen in battleground states in midterm years (see Table 4). The exception was the 2002 election, which took place about a year after 9/11, during military action in Afghanistan (‘Operation Enduring Freedom’), and amid the push for military action in Iraq (‘Operation Iraqi Freedom’ began in 2003). Besides 2002, the presidential out-party gained aggregate seats in state legislatures, and the presidential in-party lost seats in all other midterm elections.
Table 4. Midterm year state legislative seat declines by party (battleground states only)
| Election | Sitting president | D seats | R seats | D gain from prev election | R gain from prev election |
| 2002 | G.W. Bush (R) | 585 | 675 | -53 (-8.19%) | 57 (+9.28%) |
| 2006 | G.W. Bush (R) | 634 | 629 | 64 (+11.31%) | -62 (-8.93%) |
| 2010 | Obama (D) | 649 | 982 | -171 (-26.51%) | 177 (+28.69%) |
| 2014 | Obama (D) | 626 | 1006 | -56 (-8.16%) | 57 (6.02%) |
| 2018 | Trump (R) | 737 | 896 | 104 (+16.46%) | -89 (-8.90%) |
It’s notable that these shifts, known as declines, are much larger in magnitude than the surges seen in presidential election years during the same time period. The declines that follow the surges appear to wipe out all gains seen in the surges and more. The largest magnitude presidential year surge was 6.32% for Obama in 2012, and the smallest midterm year decline was 8.16% for Obama in 2014. This means the smallest midterm decline in the years investigated is larger than the largest presidential surge observed.
Figure 1. Magnitude of surges and declines from 2002-2020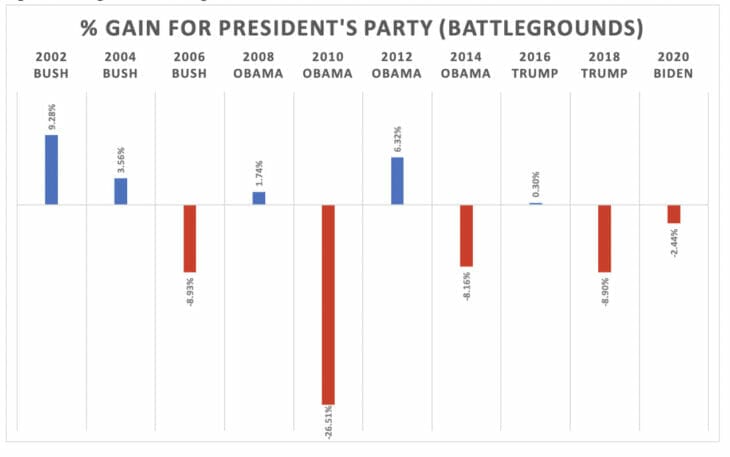
c. Projecting 2022 Outcomes
It is difficult to generalize these percentages to project Democratic losses for 2022. Each election year is unique, and outcomes are dependent on things that happened in previous election years. If 2022 holds the pattern we observed, Democrats should expect a decline in the number of state legislative seats occupied, and Republicans should expect an increase. Over the previous 2 decades, the magnitude of the declines state legislative co-partisans of the sitting president experienced ranged from 8.16% to 26.51%. Even if we cannot predict an exact number, the trend would suggest that, barring a 9/11-level event, Democrats are looking at significant midterm state legislative losses.
(3) Relationship between state legislative and congressional surge and decline.
When comparing state legislative trends to trends in Congress in the same year, almost all election years track in the same direction. The only exception was the 2016 election, when Republicans gained state legislative seats in a traditional presidential surge but lost seats in Congress. And though we do not have the equivalent data for state legislatures, it appears that George W. Bush did not see a congressional surge in the 2000 election, with Republicans losing seats that same year. See Table 5.
Interestingly, the magnitude of the trends is similar for some elections and much larger in congress for others. This is partially due to there being fewer seats in congress, such that a single seat is a much larger percentage of total congressional power than state legislative power. But it’s worth noting that in the 2010 and 2018 midterm elections, which were both midterms that occurred during a president’s first term, congress saw larger magnitude shifts in seats than did state legislatures. But, echoing the state legislative trends, the smallest shifts mostly occur during presidential elections, while larger shifts mostly happen during midterms.
Interestingly, in the 2020 election, the elected president’s party (Democrats) lost seats in state legislatures and congress. This is in contrast to the 2012 election, where Democrats gained both state and federal legislative seats, and to the 2016 election, where Republicans lost seats at one level (federal) but gained them at another (state legislative). In comparison, the decline phenomenon is reliably seen in 2010, 2014, and 2018 across state legislatures and congress.
Table 5. Surge and Decline for Congressional and Legislative Seats by Party
| Election | President* | D leg seats | R leg seats | D leg gain | R leg gain | D congress seats (gain) | R congress seats (gain) |
| 2000 | W. Bush (R) | – | – | – | – | 6 (2.34%) | -7 (-2.52%) |
| 2002 | W. Bush (R) | – | – | – | – | -9 (-3.44%) | 9 (3.32%) |
| 2004 | W. Bush (R) | – | – | – | – | -8 (-3.16%) | 8 (2.86%) |
| 2006 | W. Bush (R) | – | – | – | – | 37 (15.10%) | -37 (-12.85%) |
| 2008 | Obama (D) | – | – | – | – | 32 (11.35%) | -32 (-12.75%) |
| 2010 | Obama (D) | 3,356 | 3,944 | -675 (-16.75%) | 698 (21.50%) | -70 (-22.29%) | 70 (31.96%) |
| 2012 | Obama (D) | 3,501 | 3,907 | 145 (4.39%) | -37 (-0.94%) | 10 (4.10%) | -10 (-3.46%) |
| 2014 | Obama (D) | 3,173 | 4,081 | -328 (-9.59%) | 174 (4.56%) | -22 (-8.66%) | 22 (7.89%) |
| 2016 | Trump (R) | 3,129 | 4,203 | -44 (-1.40%) | 122 (2.97%) | 9 (3.88%) | -9 (-2.99%) |
| 2018 | Trump (R) | 3,443 | 3,857 | 314 (9.64%) | -346 (-8.60%) | 39 (16.18%) | -39 (-13.36%) |
| 2020 | Biden (D) | 3,312 | 4,007 | -131 (-3.79%) | 150 (3.89%) | -10 (-3.57%) | 10 (3.95%) |
*President elected in that year’s election (presidential) or sitting president during that year’s election (midterms)
**Discrepancies between Democratic gains/losses and Republican gains/losses in the same year accounted for by third-party seats and vacancies
Discussion
Overall, the data suggest that the surge and decline phenomenon that has been observed at the federal level also exists in state legislatures. In the entire country and in battleground states only, we observed a relatively reliable pattern of surge and decline. Cases in which patterns deviated, like the 2002 midterm where Republicans saw an increase in seats rather than a decline, and the 2020 presidential election where Democrats saw a decrease in seats rather than a surge, were rare. These trends were also seen in crucial battleground states.
Interestingly, and perhaps most importantly, it appears that at both the state legislative and Congressional levels, the decline phenomenon is larger in magnitude than the surge phenomenon and may be somewhat more reliable in recent years than surge, at least in battleground states. Declines were devastating in size compared to surges. Presidential copartisans appear to get a small boost of support when they come into office, followed by a precipitous drop in support that results in an aggregate midterm decline of seats that dwarfs the surge.
It appears that congressional trends echo the state legislative trends, though the congressional trends are sometimes higher in magnitude. There is only one case in the past decade, 2016, in which the congressional pattern differed from the state legislative pattern. This general concurrence indicates that we should expect similar trends in terms of surge and decline in direction at both the state legislative and congressional levels, but perhaps not in terms of magnitude.
There are a variety of limitations to the data. There are only 3 presidential and 3 midterm elections in the state legislative analysis of the entire country. Even when election data is extended back to 2000, that only adds one additional president, George W. Bush, to the data. The limited time period and the small number of individual presidents make it challenging to draw firm conclusions or use this data to make future predictions.
Further, the battleground states investigated in the battleground investigation are limited in number. Finally, this data is correlational. It is impossible to know why any of these gains or losses occurred, or why some years did not follow conventional patterns, which limits our ability to say what happened in these elections with certainty. Though it may be helpful to extend further into the past, increasing partisanship and decreasing ticket splitting may suggest that including more elections moving into the future may give us a clearer picture of modern surge and decline.
Based on this data, both congressional and state legislative Democrats should expect to lose seats in the 2022 election. Though it is impossible to project the magnitude of the loss, Democrats would be well-served to take this election seriously.
You can find the dataset for this project here.
References
Burmila, E. M. (2014, September). Surge and decline: The impact of changes in voter turnout on the 2010 Senate elections. In Congress & the Presidency (Vol. 41, No. 3, pp. 289-311). Routledge.
Campbell, A. (1960). Surge and decline: A study of electoral change. Public opinion quarterly, 24(3), 397-418.
Campbell, J. E. (1986a). Presidential coattails and midterm losses in state legislative elections. American Political Science Review, 80(1), 45-63.
Campbell, J. E. (1986b). Predicting seat gains from presidential coattails. American Journal of Political Science, 165-183.
Campbell, J. E. (1987). The revised theory of surge and decline. American Journal of Political Science, 965-979.
Campbell, J. E., & Sumners, J. A. (1990). Presidential coattails in Senate elections. American Political Science Review, 84(2), 513-524.
Campbell, J. E. (1991). The presidential surge and its midterm decline in congressional elections, 1868-1988. The Journal of Politics, 53(2), 477-487.
Ferejohn, J. A., & Calvert, R. L. (1984). Presidential coattails in historical perspective. American Journal of Political Science, 127-146.
Gershtenson, J. (2002). Campbell v. Campbell: An Examination of the Original and Revised Theories of Surge and Decline. Journal of Political Science, 30(1), 1.