

Abstract: Sister District Action Network (SDAN) teamed up with Dr. Josh Ackerman and PhD candidate Iris Wang from the University of Michigan to conduct a randomized controlled trial via survey in July 2020 in order to investigate the effect of Covid-19 on voter thoughts and attitudes. Voters were randomly assigned to view a slideshow emphasizing either the public health impacts or the economic impacts of COVID-19, and then were asked to respond to a variety of questions about how they perceived crowdedness and voting. We found that voters’ partisanship scores and perceived vulnerability to disease were significantly related to their negative and positive feelings about voting and transportation locations; support for a variety of socially distanced and absentee voting methods; and trade offs between voting and public health.
Objective: This study explored voters’ impressions of crowdedness, as well as feelings, attitudes, and behavioral preferences around voting as they pertain to the COVID-19 pandemic.
Background: A large academic literature explores the psychological reaction to disease threats in the environment. For instance, when confronted with indicators of infectious disease (like people appearing or sounding sick), we tend to engage in a variety of both mental (e.g., having a heightened sense of detection for disease threats) and behavioral defenses1,2 (e.g., avoiding other people) to prevent ourselves from becoming ill. Research also indicates that higher levels of disease threat (like being present in areas where disease outbreaks are more common) are associated with more risk-aversion,3,4 more social conformity,5,6 and even more authoritarian governments.7,8 Further, Wang and Ackerman9 have shown that disease threats can increase impressions of crowdedness, which is something that may be related to voting, as polling places sometimes have long lines. The COVID-19 pandemic during a Presidential election year in the US presented an opportunity to explore voter attitudes during a time when almost everyone is feeling some sense of disease threat. This initial survey helped us measure voter attitudes, and after the election, we will also explore if these attitudes altered voter behavior (in other words, whether folks voted or not and if they used an absentee method or not).
Specifics: SDAN pulled a list of all voters with listed cell phone numbers registered in 9 congressional districts chosen to represent a wide range of partisan levels in California, Florida, and Michigan. 50,185 voters were chosen at random to receive survey invitations via text message. In the survey, approximately half of voters were shown a slideshow emphasizing the public health impacts of COVID-19 and the other half were shown a slideshow emphasizing the economic impacts of COVID-19. After viewing one of these slideshows, voters saw both crowded and empty pictures of the inside of a subway, the inside of a voting room, and the outside of a voting room. Voters rated each picture on a variety of measures indicating negative feelings (feeling the scene is crowded, likely to cause folks to come into physical contact, and feeling like one would feel confined in the scene) and positive feelings (wanting to be present in the scene, feeling positive when they look at the scene). Voters also indicated their support for various voting methods; in person voting social distance measures; and tradeoffs that prioritize public health in the context of voting in a pandemic. Text message invitations went out from July 6-9, 2020 and the survey closed on July 13, 2020. 564 of the voters texted completed or mostly completed the survey.
Basic Takeaways:
- Voters with left-leaning partisanship scores (“left-leaning voters”) were more likely to endorse a variety of early and vote by mail/absentee voting methods than voters with right-leaning partisanship scores (‘right-leaning voters”; ps = 0.013 and lower).
- Left-leaning voters are more likely to endorse actions and statements that prioritize public health in the context of voting during a pandemic (p < 0.001). These actions include support for postponing the election if the pandemic was still an issue in November and endorsing statements that indicate more willingness to give up personal freedoms to protect public health.
- However, it is important to note that right-leaning voters were not necessarily opposed to alternative voting methods and voting public health trade offs, but they were less likely to support them than left-leaning voters.
- Left-leaning voters feel more negatively and less positively about pictures of voting and transportation locations than right-leaning voters (ps = 0.042 and lower). This indicates that people who are more left-leaning may be more concerned about public spaces and crowds than right-leaning voters. Interestingly, people felt more similarly about the transportation photos and diverged more on the photos of voting locations based on their political leanings.
1) Left-leaning voters were more likely to endorse early voting, absentee/vote by mail, and socially distanced in person voting methods.
- Across several regressions, people who leaned more to the left generally expressed more support for early voting, vote by mail with and without polling places, no excuse and permanent absentee voting than did right-leaning voters. Left-leaning voters also expressed less support for in-person voting on election day only, compared to right-leaning voters (all ps = 0.013 or lower).
- Left-leaning voters were significantly more likely to endorse socially-distanced in person voting measures like putting plexiglass between voters and poll workers, using new writing utensils for each voter, using social distancing markers on the floor, etc. than right-leaning voters (p < 0.001).
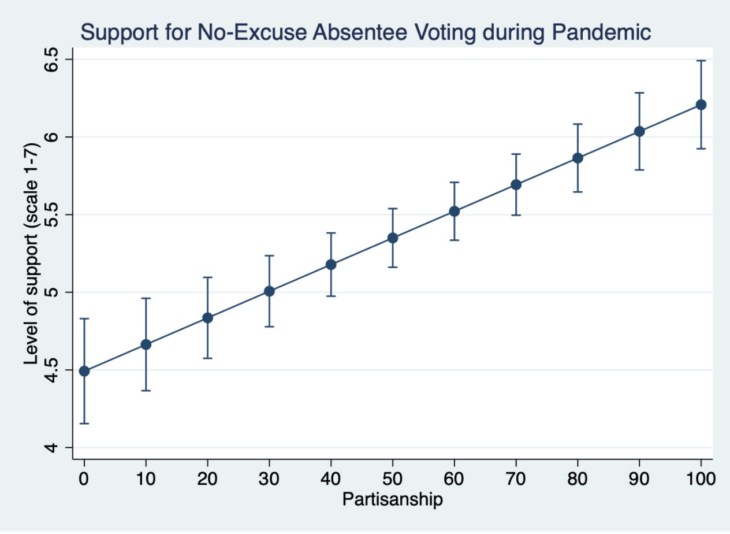 Figure 1. An example of support for one of the voting methods tested by partisanship. Right leaning voters (located on the left side of this graph with scores 0-50) are less likely to support voting with no-excuse absentee ballots during the pandemic than left leaning voters (located on the right side of this graph with scores 50-100).
2) Left-leaning voters were more likely to endorse tradeoffs that prioritize public health in the context of voting in a pandemic.
- Voters were presented with measures about voting and public health tradeoffs like “I would be willing to give up some of my individual freedoms to help protect our country against COVID-19,” and “During the current election cycle, is the ability to vote (hold elections) more or less important than maintaining public health (not making issues involving COVID-19 worse)?” Left-leaning voters were more likely to endorse actions and statements that prioritized public health in the context of voting during a pandemic compared to right-leaning voters (p <0.001).
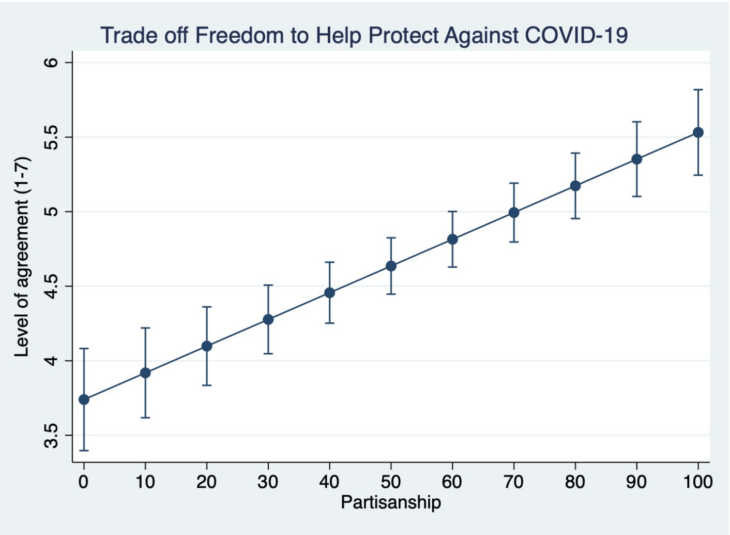 Figure 2. An example of level of support for the statement “I would be willing to give up some of my individual freedoms to help protect our country against COVID-19” by partisanship. Right-leaning voters (located on the left side of this graph with scores 0-50) are less likely to agree with that statement than left-leaning voters (located on the right side of this graph with scores 50-100).
3) Partisanship affected feelings about the pictures.
- Across all pictures, left-leaning voters (represented by higher numbers for partisanship) expressed fewer positive feelings and more negative feelings (ps for interaction terms all 0.109 or below) about the pictures of voting and transportation locations than right-leaning voters. It is possible that this indicates that left-leaning voters are more concerned about being in public spaces during the pandemic than right-leaning voters.
Caveats and considerations:
- The crowded outside voting room photo was ambiguous. It was unclear whether the picture meant to depict a crowded photo outside of a polling place was indoors or outdoors. More testing is needed to determine if voters perceived this photo as being outside.
- People were not randomly chosen. The voters that took part in this study live in only 9 congressional districts in only 3 states in the US. Further, people who received text message invitations to take the survey self-selected whether to participate or not. This means that there may be systematic differences between the people who did and did not participate, so the results may not be generalizable.
- Most of the findings are non-experimental. Partisanship is a naturally occurring variable and was not manipulated in the study. That means it is hard to draw causal inferences about many of the findings.
Contributions and Future Directions:
This study helps to extend disease threat research into the 2020 election, as COVID-19 presents an unprecedented threat to our country during a major election year that necessarily requires some contact between voters at polling places. This research helps to illuminate viewpoints on these issues, for instance that most voters are in favor of a variety of voting methods, even though some folks (like voters with left-leaning partisanship scores or people worried about their vulnerability to getting COVID-19) support these measures more than their less partisan or less vulnerable counterparts.
For continued exploration in this study, we will track voters to determine if and how they vote. This will give us another two outcomes to explore, and be able to see how concerns about voting in July affected actual voting behavior in the Fall. Further, in order to clarify the findings regarding the pictures, the pictures should be post tested to determine if the crowded voting picture outside the polling place (as opposed to completely outdoors) is perceived by voters as being outside (as opposed to inside).
While far from conclusive, this research provides compelling evidence to back up the idea that voters with left-leaning partisanship scores are more enthusiastic about voting by mail/absentee voting, as well as encouraging social distancing during in person voting. However, the results also indicate more support than not among respondents for most voting methods and measures, indicating potentially less resistance among voters with right-leaning partisanship scores for these measures than previously thought.
This research was done in collaboration with academic partners and is in potential development for publication. We will release more detailed information as soon as possible. If you have questions about these findings please email Mallory.
References:
- Schaller, M. (2016). The behavioral immune system. In D. M. Buss (Ed.), The handbook of evolutionary psychology (2nd ed., Vol. 1, pp. 206–224). Hoboken, NJ: Wiley.
- Tybur, J. M., & Lieberman, D. (2016). Human pathogen avoidance adaptations. Current Opinion in Psychology, 7, 6–11.
- Prokosch, M. L., Gassen, J., Ackerman, J. M., & Hill, S. E. (2019). Caution in the time of cholera: Pathogen threats decrease risk tolerance. Evolutionary Behavioral Sciences.
- Neuberg, S. L., Kenrick, D. T., & Schaller, M. (2011). Human threat management systems: Self protection and disease avoidance. Neuroscience and Biobehavioral Reviews, 35, 1042–1051.
- Murray, D. R., & Schaller, M. (2012). Threat (s) and conformity deconstructed: Perceived threat of infectious disease and its implications for conformist attitudes and behavior. European Journal of Social Psychology, 42(2), 180-188.
- Murray, D. R., Trudeau, R., & Schaller, M. (2011). On the origins of cultural differences in conformity: Four tests of the pathogen prevalence hypothesis. Personality and Social Psychology Bulletin, 37(3), 318-329.
- Murray, D. R., Schaller, M., & Suedfeld, P. (2013). Pathogens and politics: Further evidence that parasite prevalence predicts authoritarianism. PloS One, 8(5).
- Thornhill, R., Fincher, C. L., & Aran, D. (2009). Parasites, democratization, and the liberalization of values across contemporary countries. Biological Reviews, 84(1), 113-131.
- Wang, I. M., & Ackerman, J. M. (2019). The infectiousness of crowds: crowding experiences are amplified by pathogen threats. Personality and Social Psychology Bulletin, 45(1), 120-132.