
Gaby Goldstein JD PhD, SDAN Director of Research
Mallory Roman PhD, SDAN Associate Director of Research
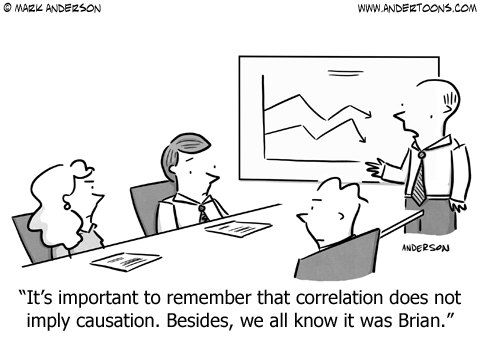
Correlation Does Not Equal Causation
You’ve probably heard the phrase “correlation does not equal causation” — but what does it mean?
Correlation: a mutual relationship or connection between two or more things.
Causation: the action of causing something; the relationship between cause and effect.
Take this example:
Let’s say we’re looking at data and notice that both crime rates and ice cream sales peaked in July and August. Those results appear correlated. But how are they connected? Does one influence the other? If so, how? To find out, we investigate causation, and explore a question like “does an increase in crime cause an increase in ice cream sales?” We’d find out pretty quickly that there is no causality. High crime rates and ice cream sales simply share a common cause: they happen more often in the summer than at other times in the year. It’s this third thing — summer — that is causatory and explains the correlation.
This “third thing” is something scientists call a ‘confounding’ variable. This means that there is something going on in the background of your study that you aren’t measuring, which actually accounts for the results you see.
A lot of studies, including studies about voting and turnout, report results that are correlations. But there are reasons to be skeptical of these results — because, as we know, correlations do not indicate causation. Studies that report correlations may be missing the actual thing that explains the result, and over-selling the value of the findings.
Better than Correlations: Randomized Controlled Trials
A much better approach to understanding if one thing (e.g. sending a postcard to a voter) is related to another thing (higher rates of voting turnout) is to run a randomized controlled trial (RCT). In a RCT you do 2 major things that help make the results reliable: you randomize a sample of people into conditions, and you control the “environment” of the experiment.
Let’s use the example of a study that aims to see whether sending a postcard encouraging a voter to show up and vote on election day increases voter turnout.
- Randomization: In a RCT, the scientist first randomly chooses a set of people from the larger population she is studying, so that they are representative of the larger group. For instance, she may randomly select 1,000 out of 50,000 voters in a state senate district. Then, she randomly assigns (‘randomizes’) those 1,000 people into 2 ‘conditions’ (the different groups in an experiment). 500 people are randomized into receiving a postcard, and 500 are randomized into a ‘control group’ who will receive no card. Holding out a control group is an extremely important part of any RCT, which allows the scientist to statistically test if what she did (e.g., send postcards to voters) worked significantly better than doing nothing. We can also make sure the results hold across people with different personal characteristics like age and gender by ‘controlling’ for things like age and gender. Our scientist does this by randomly assigning voters of different ages and genders to the two conditions (receive postcard/not receive postcard). This helps ensure that the results she finds will be valid across age and gender, because people of all ages and genders will be included in roughly the same amounts in both conditions.
- Experimental control: Ideally, we want everyone who is in the experiment to experience the exact same things while in the study. But we can’t always control the environment people are in when they are involved in studies, especially when they involve outcomes that happen well after they leave ‘the lab’, like voting in an election weeks after getting a postcard. When we can’t study something literally in a closed-system lab, we can still control the experience of people in a study by doing things like using a script on the postcard that doesn’t vary.
Experiments aren’t perfect. But RCTs are the gold standard of research for a reason: they are our best tool for really honing in on the influence of an intervention and they are the best way to determine that something causes something else.
To be clear, correlations can also be useful. For instance, the research that links smoking to lung disease is necessarily correlational (we can’t randomly assign people to be lifelong smokers or not), but people rarely doubt that smoking presents a danger to the lungs based on many years of observation by medical researchers. As in the ice cream / crime example above, correlations provide reason to look at something deeper, to think about the logical story the correlation is telling, to gather more evidence, and, if possible, to conduct some experiments that will help us tell more of the story. But they do not provide conclusive evidence that something was caused by something else. For that, you need to run an experiment like an RCT.
Political Research Does Not Need to Rely on Correlations
In political research, we do not need to rely on correlations. We can — and do — run RCTs to determine if our interventions are ‘working.’ For instance, we have run RCTs to see if sending postcards to encourage voter registration as part of a voter registration program helps boost registration completion. In an RCT, we are not merely looking at whether receiving a postcard is correlated with higher registration. Instead, because we have held out a control group and randomized a representative sample of residents into conditions, we can isolate the effects of the intervention and determine that it did or did not cause any change we see in the outcome.
Don’t settle for correlations! Look for studies that have undertaken experiments with a control group and that report statistically significant results.
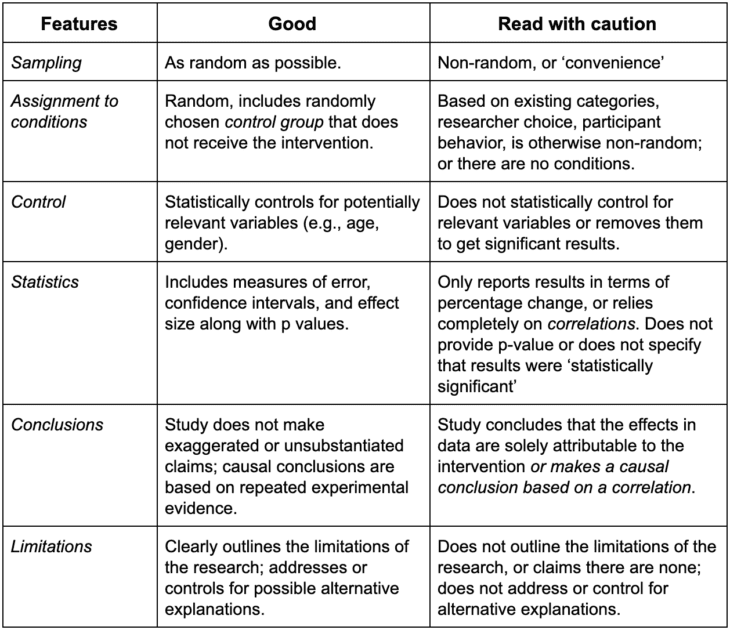
No study is perfect, and both experiments (RCTs) and correlational studies can have good and bad features. The chart below can help you contextualize the study results you read.
We hope this is a helpful explainer! If you have any questions or feedback, let us know.
Please support our work at SDAN!
Additional resources:
Correlations:
Tyler Vigen’s spurious correlation examples/charts
In depth American Scientist article about correlations
Types of studies:
Textbook chapter discussing various types of studies 1
Textbook chapter discussion various types of studies 2
Random sampling and common issues in achieving random samples:
SPSS tutorial on Simple Random Sampling
SPSS tutorial on Survey Sampling
Textbook chapter covering additional types of probability/non-probability sampling