

Abstract: This study tested the effect on turnout of receiving a handwritten postcard highlighting the policy votes that a voter’s state legislative representative cast in opposition to the modeled policy position of the voter. The study design was a randomized controlled trial, with a postcard condition in which voters received a handwritten postcard with issue-specific messaging, a social pressure mailer condition (in which voters received a social pressure, non-issue-specific printed mailer), and a control condition in which voters did not receive any mail. The postcards were sent to Georgia and Pennsylvania voters ahead of the 2022 midterm general elections. Inclusion criteria included a modeled pro-choice support score at or above 70, and having a state representative or senator who voted for anti-abortion bills.
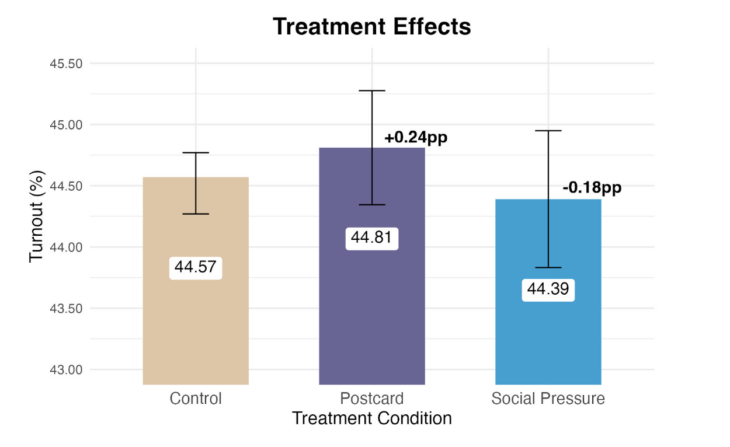
In the analysis, the numbers trended in the expected direction, with voters in the postcard condition voting at a higher rate than voters who did not receive a postcard, but this result did not reach statistical significance (p = 0.30). Results indicated that the postcards had a smaller than expected effect (0.24 percentage points higher than the turnout rate of the control condition) but it still exceeded the effect of the social pressure mailers (0.18 percentage points lower than the turnout rate of the control condition, but also not statistically significant with a p-value of 0.53).
There were no statistically significant moderation effects based on the treatment condition interacted with predicted turnout score, pro-choice issue support score, or state.
Objective: This study was a replication of SDAN’s 2021 values-matched messaging study, and sought to determine the effects of educating voters who care about specific issues about their legislators’ votes on bills that are out of sync with the voter’s policy positions.
Background: This study was a randomized controlled trial (RCT) conducted during the 2022 midterm election in Georgia and Pennsylvania, specifically targeting people who were likely supporters of pro-choice policies with postcards educating them about their legislators’ anti-abortion voting records.
Specifics: This study was a RCT designed by SDAN. The study targeted all Georgia and Pennsylvania voters who met the inclusion criteria: midterm turnout scores 0-80, partisanship scores of 70+, and pro-choice issue support scores of 70+; and also lived in a district where their incumbent state representative voted for the anti-abortion legislation highlighted on the postcard and was being challenged by a Democrat in the election. Participants were randomly assigned to one of 3 conditions (control, postcard, or social pressure mailer). This resulted in 60,000 people randomized into the postcard condition, 38,000 people randomized into the social pressure condition, and 194,094 in the control group. Volunteers completed the postcards according to the scripts, and sent them in bulk to in-state partners in Georgia and Pennsylvania for in-state mailing around October 17-19, 2022. We estimate that they were delivered to homes from October 23-October 27. Due to late grant funding, only 41,609 postcards were written and sent (~69% of those assigned to the postcard condition). We analyzed the data with an intent-to-treat approach that preserved participants in the postcard condition if they were originally sorted into that condition, even if they did not actually receive the treatment. After the election, data was matched back to TargetSmart’s voter file to determine if voters targeted in this study voted in the 2022 general election. When matching back to the voter file, 12,153 people did not match back. Those people were removed from the analysis since they had no values for the outcome variable (voting). This left a sample of 279,941 individuals.
Basic Takeaways
- People in the postcard treatment group had the highest turnout rate of all of the conditions. Turnout among voters who received a postcard was 44.81%, while voters who did not receive anything turned out at a rate of 44.57%—a difference of 0.24 percentage points. However, this difference was not statistically significant (p = 0.30). People in the social pressure group voted at the lowest rate (44.39%).
- This difference in turnout rates between the postcard group and the control group was smaller than the one we observed when we ran a similar experiment in 2021 (0.67 percentage points). This adds to the evidence that postcards, like most tactics, are more effective in quieter election contexts where voters are receiving fewer voter contact touches. The ‘noisier’ election context in 2022 likely contributed to the smaller observed effect.
- The effect of receiving a postcard did not differ based on people’s predicted midterm turnout scores or their modeled issue support scores. The same was true for receiving social pressure mailers.
- While the postcard treatment effect did not meet the standard threshold for statistical significance, it was associated with higher voter turnout than both no contact and social pressure mail. Further research is needed to determine the boundaries and best applications of the strategy.
- This study has several limitations to consider, and we caution against making any broad generalizations based on these results.
- Limitations include somewhat narrow inclusion criteria, lack of adequate statistical power, and a focus on specific legislative districts in two battleground states.
Key Findings
Results suggest that people who received postcards voted at a higher rate than people who received nothing (the control group) and people who received social pressure mailers.
- The turnout for voters who received a postcard was 44.81%, while voters who did not receive anything turned out at a rate of 44.57%. This difference of 0.24 percentage points was not statistically significant in the main model (p = 0.30).
-
- This means that, although the turnout rate was higher among people who received postcards, the difference was not large enough to be statistically meaningful.
- Interestingly, postcard recipients also voted at a rate that was 0.42 percentage points higher than voters who received social pressure mailers (44.81% for postcard recipients versus 44.39% for social pressure mail recipients). This difference was not statistically significant (p = 0.20).
- Again, although the turnout rate was higher among people who received postcards compared to social pressure mail, the difference was not large enough to be statistically meaningful.
The turnout rate was lowest among people who received social pressure mailers, though the differences compared to the control group and the postcard group were not statistically significant.
- Compared to the control group, people who received social pressure mail had lower turnout (-0.18 percentage points). Again, it is not statistically significant, but it means that, in this sample, social pressure mailers did not increase voter turnout above the level of those who received no communication.
There were no significant moderation effects based on predicted turnout score.
- The effect of midterm turnout score on voting did not vary significantly by experimental condition.
- This means that people did not respond differently to the postcards or social pressure mailers based on their predicted likelihood of voting.
There were no significant moderation effects based on pro-choice issue support scores.
- The effect of the pro-choice issue score on voting did not vary significantly by experimental condition.
- This means that people did not respond differently to the postcards or social pressure mailers based on their modeled likelihood of supporting reproductive rights.
Caveats and Considerations
- Generalizability is limited. There were extensive inclusion criteria in this study that make it difficult to generalize these results to other election contexts or populations. Future studies will help to determine the boundaries of this particular effect.
- We are underpowered to detect effects. We are generally underpowered to detect the effects of both the postcards and social pressure mailers. This means that these tests should be replicated using a larger sample of people.
- We weren’t able to contact all targets. We were only able to treat 69% of the postcard condition participants, meaning that a large chunk of this condition was not treated at all. As a result, the effect of the postcards is likely a conservative estimate.
Conclusions and Future Directions
The hypothesis that the people who received postcards would vote at higher rates than people who did not appears to have suggestive evidence, with results trending in the same direction as the original study conducted in 2021. However, none of the treatment effects rose to statistical significance, and results should simply be taken as educational. Neither modeled midterm turnout scores nor pro-choice issue support scores moderated the effect of the treatment condition.
Social pressure mailers appeared to be less effective than postcards, but the effect was not statistically significant in the main model (p = 0.20). This indicates that postcards had a stronger positive effect on people in this sample than social pressure mail—widely considered a gold standard of GOTV mail. The results also indicate, when taken in the context of the previous values-matched messaging postcard study results, that the noisier election context of the 2022 midterms probably decreased the efficacy of the values-matched messaging postcards.
Future research should explore this tactic with a wider group of voters to see where the boundaries of the effects are, as well as to explore which populations it is most effective with. It should also be explored with larger sample sizes in more election types. This concept—that we can use issue-support scores to help connect voters with messaging that speaks specifically to them—could also be tested through a variety of modes of contact, including phonebanking, textbanking, and canvassing.
If you’re interested in reading more about this study, a longer report can be found here.
SDAN’s commitment: It is SDAN’s intention to provide as much context as possible to allow for the nuanced interpretation of our data. SDAN’s convention is to contextualize effects by reporting p values, confidence intervals, and effect sizes for all models tested (these items may be in the longer report linked in the blog). Additionally, SDAN always differentiates between planned and exploratory analyses and a priori and post hoc tests, and reports the results of all planned analyses regardless of statistical significance. If you have questions about these findings please email [email protected].